Coming Soon

Real-time waste
analytics dashboard.

We're building a live dashboard that tracks every item Recycla sorts — giving you real-time visibility into how much waste is being diverted from landfill, broken down by material type, time of day, and location.

What to expect

Smart insights from every sort.

The Recycla Dashboard will connect directly to our smart bins, aggregating classification data into actionable insights for campus facilities teams and sustainability offices.

Real-time sorting feed

Watch items get classified live. Every piece of waste logged with its category, confidence score, and timestamp.

Daily & weekly breakdown

See totals by material type — how much plastic, paper, glass, metal, and general waste is sorted each day.

Diversion rate tracking

Track the percentage of waste successfully diverted from landfill. Set targets. Measure progress.

Contamination alerts

Get notified when contamination rates spike in specific bins or buildings, so facilities teams can respond fast.

Recycla Analytics Dashboard — mobile app concept

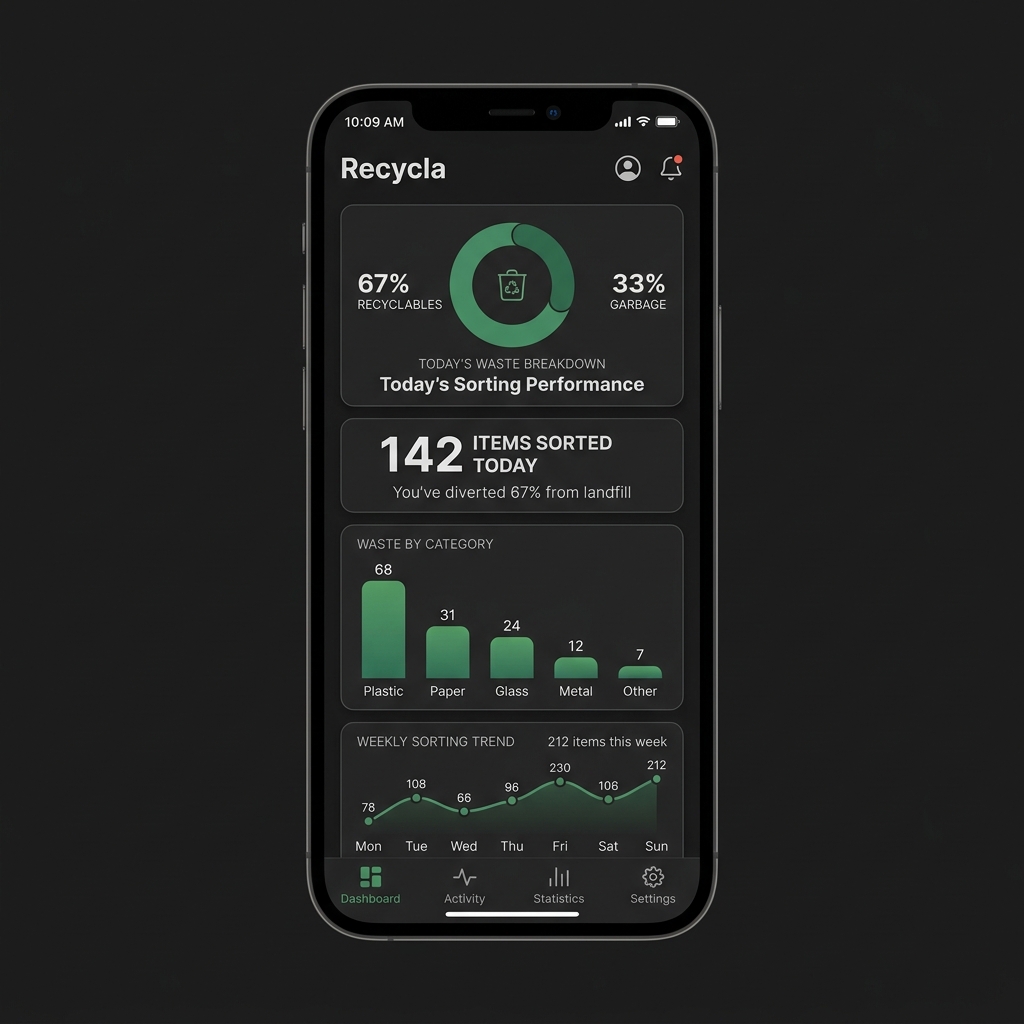
Mobile dashboard concept — live sorting stats, category breakdown, and weekly trends

Under the hood

How it will work.

Each Recycla bin will log every classification event — material type, confidence score, and timestamp — to a lightweight database via Wi-Fi. The dashboard reads from this data layer in real time, rendering charts and statistics through a responsive web interface accessible from any device.

The system is designed to scale from a single bin to a campus-wide network without changes to the dashboard architecture. Each bin simply registers itself and begins streaming data.

Data SQLite on-device, synced to cloud PostgreSQL
API REST endpoints for bin registration and data ingestion
Frontend Responsive web app with real-time WebSocket updates
Alerts Threshold-based notifications via email and webhook

See what's already built.